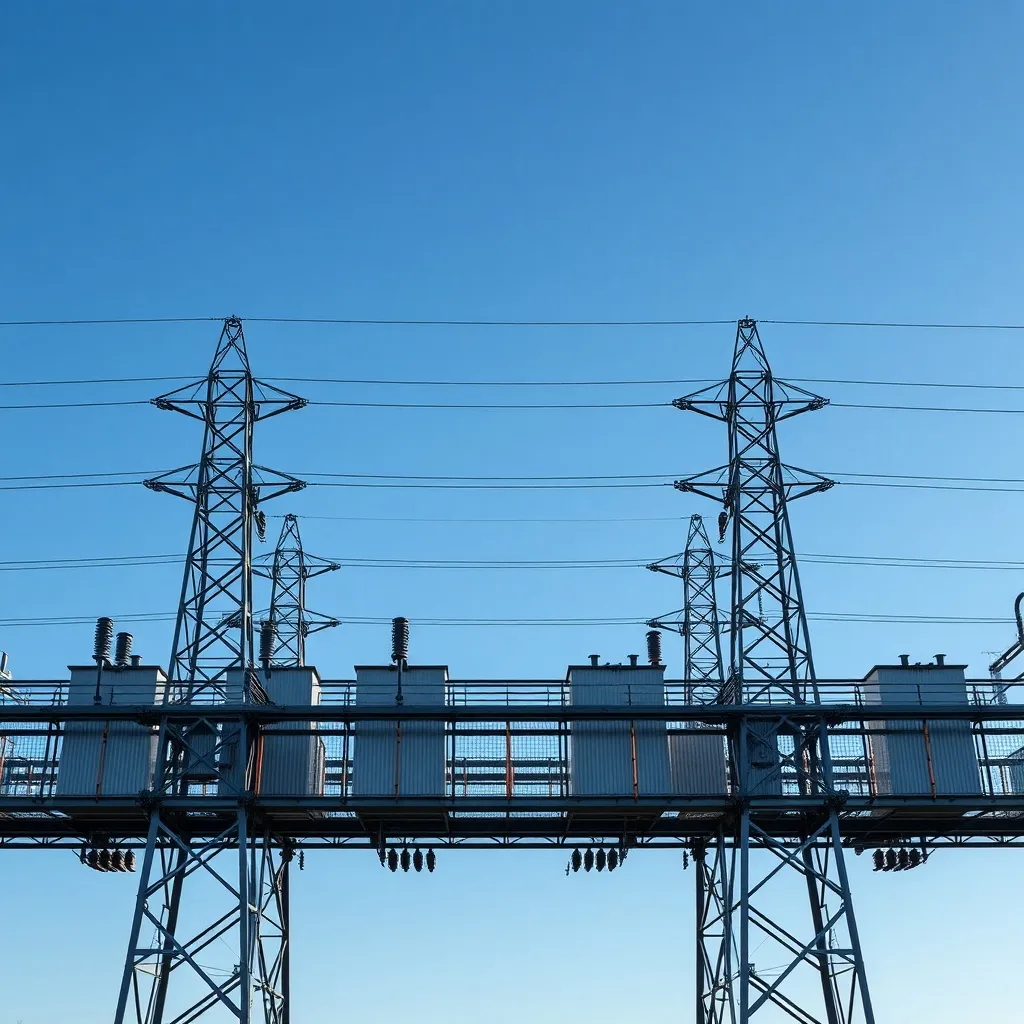
Large scale electrical power substation and transmission lin
Infrastructure Geometry

Regulated Utilities and Power Generation

An analysis of the Canadian utility sector through the lens of spatial integration and rate-regulated cash flow structures. We examine the geometric expansion of power grids and the organic stability of regulated returns.

The Architecture of Regulated Income

The Canadian utility landscape is built upon a foundation of regulatory certainty. Unlike cyclical commodity sectors, utilities function within a spatial framework defined by provincial and federal oversight. This oversight ensures that the capital invested into the "Rate Base"—the physical infrastructure of wires, pipes, and plants—earns a predictable return. For the dividend investor, this translates into a geometric consistency of payout ratios.

When we analyze utility stocks, we look at the integration of assets within their domestic and international landscapes. Companies like Fortis and Emera have demonstrated a capacity to export this regulated model across borders, integrating diverse geographical jurisdictions into a singular financial structure. This expansion is not merely growth; it is the spatial optimization of risk across multiple regulatory environments.

Power generation, specifically renewable integration, represents the modern frontier of this sector. The transition from carbon-intensive thermal plants to hydro, wind, and solar arrays requires massive capital reallocation. This shift is governed by long-term Power Purchase Agreements (PPAs), which act as the structural anchors for future dividends. These contracts provide a fixed-price floor, insulating the investor from the volatility of spot-market electricity pricing.

Understanding this sector requires a view of utilities as "bond proxies" with an embedded growth component. As the Quantitative Valuation Framework suggests, the sensitivity to interest rate movements is a primary vector of risk. However, the organic growth of the rate base often compensates for inflationary pressures, maintaining the structural integrity of the investment over decades.

Core Utility Classifications

Categorizing assets by their function within the national energy grid and their specific regulatory mechanisms.

Electric Transmission

The high-voltage backbone of the grid. These assets are characterized by extremely high barriers to entry and are often viewed as the most stable component of a Portfolio Spatial Organization.

  • Low Volatility Profile
  • icon-f Federally Regulated

Natural Gas Distribution

Local distribution networks serving residential and industrial hubs. Revenue is decoupled from volume in many jurisdictions, providing a hedge against seasonal fluctuations.

  • Stable Customer Base
  • Infrastructure Modernization

Renewable Generation

Hydroelectric dams, wind farms, and solar fields. These are the growth engines of the modern utility, often providing higher yields but carrying operational performance risk.

  • Carbon-Free Profile
  • 20-Year PPA Contracts

Rate Base Integration Geometry

The "Rate Base" is the net value of a utility’s assets used to provide service. Regulators allow utilities to recover their operating expenses and earn a fair Return on Equity (ROE) on this base. This mathematical relationship is the primary driver of dividend appreciation. As the utility invests in new substations or grid hardening, the rate base expands, justifying a proportional increase in the revenue requirement.

"The spatial expansion of the physical grid is the direct precursor to the structural growth of the dividend stream."

Investors must monitor the "Regulatory Lag"—the time between a utility spending capital and the regulator approving a rate increase. Efficient operators minimize this lag, ensuring that the integration of new capital is immediately accretive to earnings. This efficiency is what separates top-tier operators from the rest of the S&P/TSX Dividend Aristocrats.

Abstract architectural view of power lines and geometric pyl
Grid Infrastructure Geometry
8-10% Typical ROE Range
5-7% Rate Base CAGR

Projected Structural Efficiency

$1.1T
Estimated Grid Investment (2050)
65%
Avg. Payout Ratio Integrity
4.2%
Mean Dividend Yield (Sector)
22yr
Avg. Asset Lifecycle Integration
Metric Electric Utilities Gas Utilities Water/Multi
Capital Intensity High Moderate High
Dividend Growth Potential 4-6% 3-5% 5-7%
Regulatory Environment Strict Predictable Highly Regulated

Integrate Utilities into Your Structure

The utility sector provides the foundational stability required for long-term income generation. By understanding the spatial requirements of the grid and the regulatory geometry of returns, investors can build a portfolio resilient to market cycles.